The Adventures of Tom
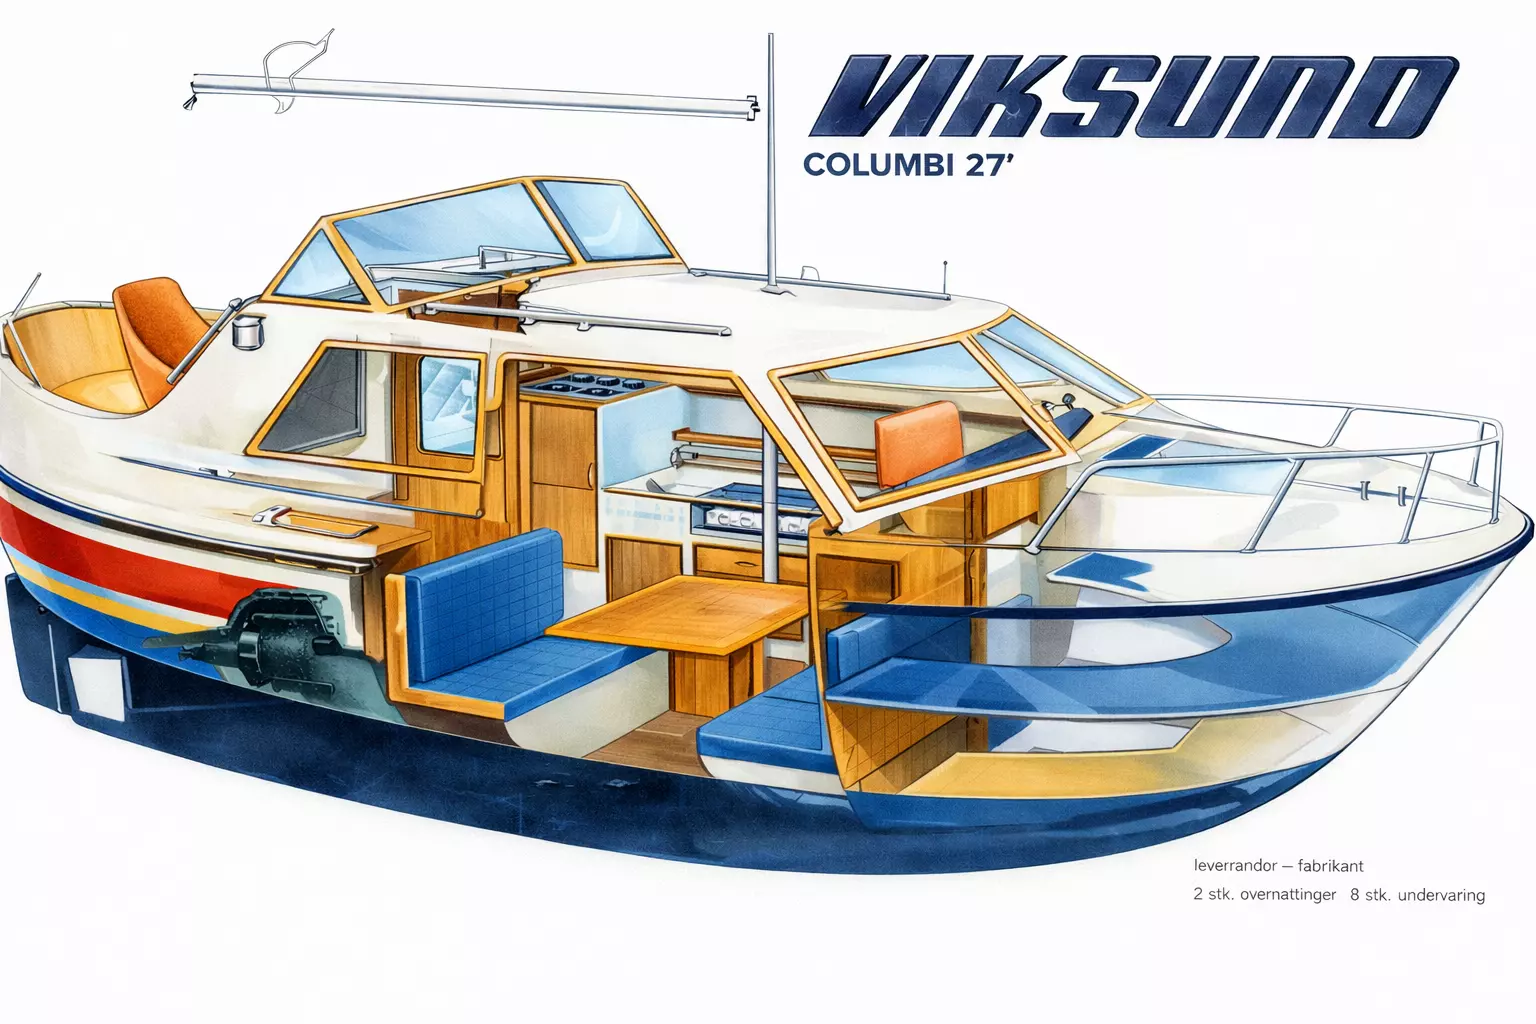
A Viksund 27 Columbi
Built in 1978
In Honor of 2 great men!
Why the name Tom?
To most, Tom might be a very common name, but for us, it holds special significance. It represents two important people in our lives:
- A Grandfather
- A Father
To honor both men, we chose to name our Viksund 27 Columbi "Tom".
Tips for navigating the site
To make the most of your experience on our website, here are some tips:
When you see this Underlined text with a info icon We try to make this website as informative and user-friendly as possible. Whenever you see underlined text with a question mark icon, it indicates that there is additional information available. , Hoover over it to read the tooltip.
History of the Viksund 27 series
Build between 1970 - 1980
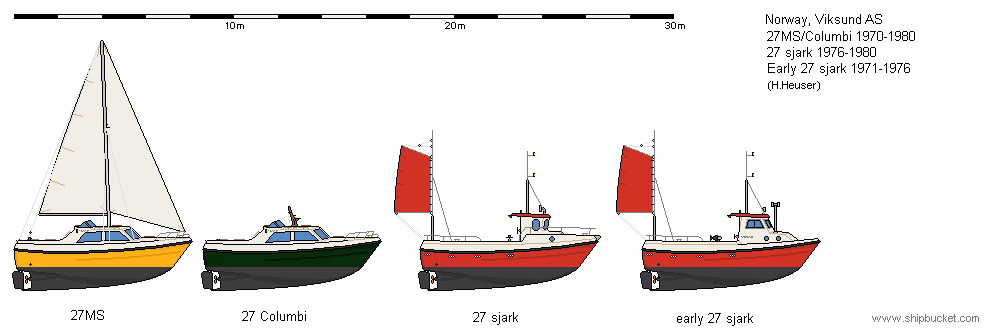
The Viksund 27 Series
The Viksund 27 was a cornerstone of Viksund's production, alongside the
Viksund 31 Goldfish.
It was available in different configurations: with or without sails and as
a fishing boat.
These boats are known for their spacious interior, large aft deck, and
excellent seaworthiness and durability.
The sailing version was not particularly fast. The non-sailing version had
only 400 kg of ballast, whereas the sailing version had 1000 kg (due to an
added steel keel).
Viksund claimed that adding ballast to the hull improved the boat’s
stability in rough seas.
Anecdotes
In the early years, Viksund faced difficulties selling fiberglass boats, as many people believed they were unsafe and unable to withstand Norway's harsh weather conditions. To prove them wrong, Viksund once dropped a 27 Columbi from a mountain and had workers strike it with 10 kg sledgehammers. Apart from some broken glass, the fiberglass hull and superstructure remained intact. After some minor repairs to the gel coat, the boat was sold and it is still sailing today!
In 1977, a brand-new Viksund 27 MS fell off a cargo ship during a winter storm. A few days later, the Norwegian Navy found it—completely undamaged and totally dry inside. They put a crew on board, started the engine, and sailed it to port. After inspection, the boat was delivered to its customer without requiring any repairs.
Back in the 1980s, a Norwegian sailor took a 27 Sjark (fishing version) across the Atlantic to New York with just a few modifications: extra fuel, a larger water supply, and a big cooler in the fishing well. The sailor later said, "All I had to do was start the engine, point the bow in the right direction, and sit back and relax—even in bad weather!"
Technical Specifications of the Viksund 27'
What it's made of!
Original Design
Here are the original design specifications of the Viksund 27 series.
Design Specifications
Material:GRP (Fiberglass)Length:8.23 meter (27 feet)Beam:2.85 meterHeight:2.40 meterDraft:1 meter (varies depending on ballast type)Hull Thickness:35 mm on the sides and bottom, with 40 mm in reinforced areas.Engine:18 to 45 hp (Volvo, Sabb, Yanmar)Speeds:8 - 9 knots with a Volvo Penta MD3B 36 hp Diesel Engine.Fuel Tank:Standard 60 or 100-liter Sabb tankWater Tank:50 to 100-liter tank (stainless steel)Weight:27 MS: approximately 4000 kg (1000 kg steel keel)
27 Columbi/Sjark: approximately 3400 kg (400 kg keel)Cost in 1973:69,900 NOK
(Equivalent to approximately 426,390 NOK (€52,000) today, adjusted for inflation)
Radio Information (VHF/AIS)
Radio & Callsigns and AIS
CallsignPD9085 - TOMMMSI244170678 - TOMVHF SetStandard Horizon GX1400GPS/E (DSC/GPS)Navigation AIS SetOnwa KP-27X (Depth/AIS/GPS)
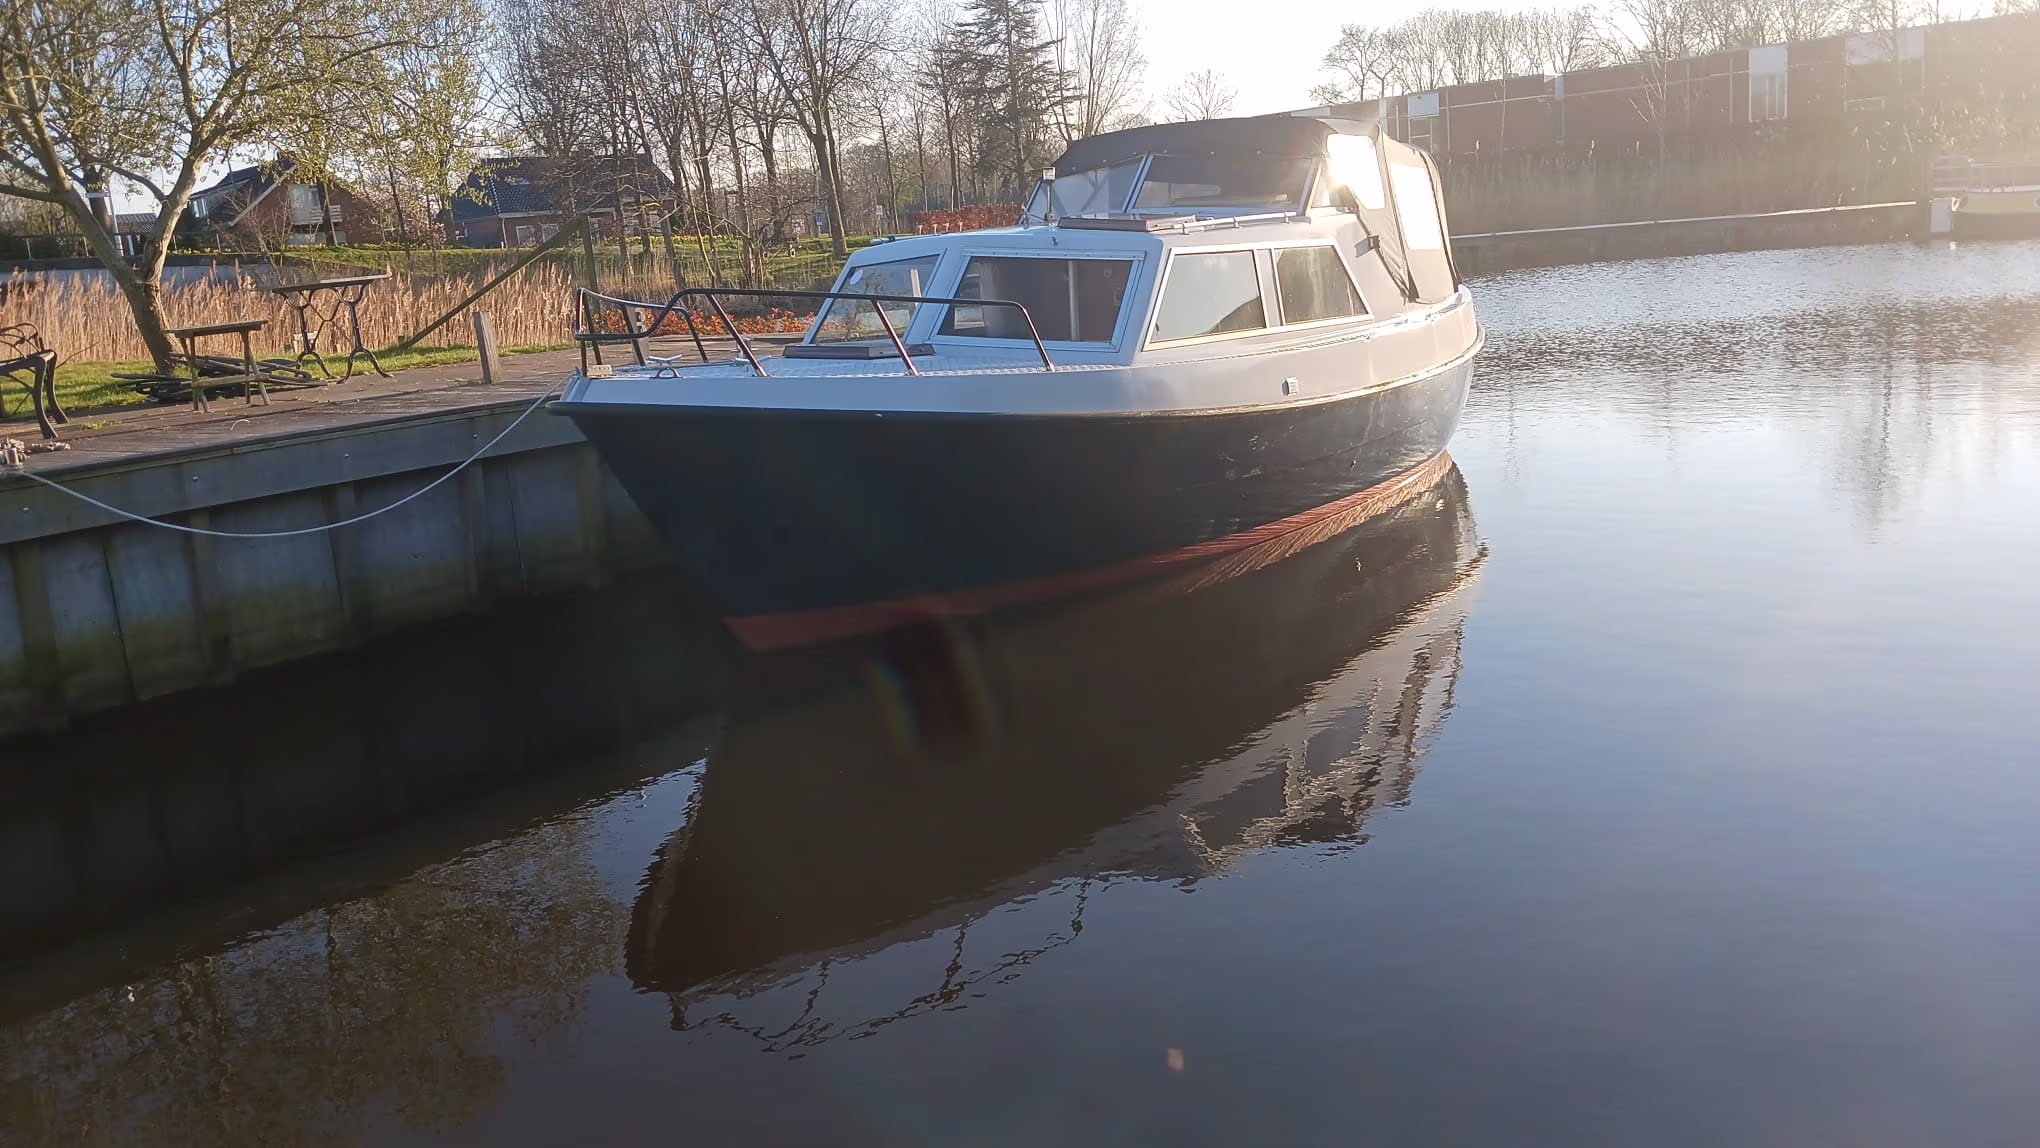
Home Port of Tom
Jachthaven Andijk
Whe found a beautiful spot for our Tom!

When it concerns a pleasure craft, the law in The Netherlands is that the owner's place of residence must be listed as the "home port" on the boat. And that can sometimes lead to hilarious results! Like, for example, a boat is moored in Harderwijk, but the owners live in Stroe. And Stroe doesn't even have a decent canal to put a boat in! But there are rules and regulations, so our home port is therefore Enkhuizen, while our actual home port is Andijk.
And yes, that’s confusing because Enkhuizen also has several (yacht) harbors. But we want to enjoy a perfect spot, with plenty of peace and quiet around us. And we found this at Jachthaven Andijk! Also, there was a waiting list in Enkhuizen. And, Broekerhaven did not even respond to my request......
Support the KNRM!
Help them to help others!
I would like to ask you to become a donor for the KNRM.
The KNRM is a fully private organisation, completely run by volunteers, financed by contributions and donations. You will find all information about them on the website.
You can choose from a single one time payment or a monthly or yearly donation. Please Support them.
Our personal opinion is that every person out on the water should, by law be told to make a donation of €25,- per year. But that is just our opinion.
Copyright, Disclaimer & Attribution
The legal stuff needed because of stupid....
The content on this website may include materials such as text, images, videos, and other media that are the property of their respective owners. All trademarks, logos, and copyrighted works remain the intellectual property of their original creators.
We strive to properly attribute and acknowledge all sources. If you are the copyright owner of any material featured on this site and believe it has been used without appropriate credit or permission, please contact us at [your contact email] so we can promptly address the issue.
Where applicable, the use of third-party content falls under fair use, creative commons licenses, or other applicable legal provisions. If specific attribution is required, it is provided directly alongside the respective material.
The images and data on this site are NOT intended for navigation or critical decision-making. Any reliance on this information is strictly at your own risk. The information on this site is for PERSONAL USE ONLY. You may print or copy parts of it for your own private use. Commercial use is strictly FORBIDDEN. Do not sell, rent, or use this data for profit. Unauthorized commercial exploitation will be met with rigorous legal action to the fullest extent of the law Furthermore, automated data scraping, harvesting, or feeding this content into large language models or AI systems is strictly PROHIBITED. If automated tools crawl this site without express written permission, access will be blocked, and those responsible will be held liable for unauthorized bandwidth usage and intellectual property infringement.
Powered by Haringstad
Build with VIM
© Haringstad, J and S van Koll